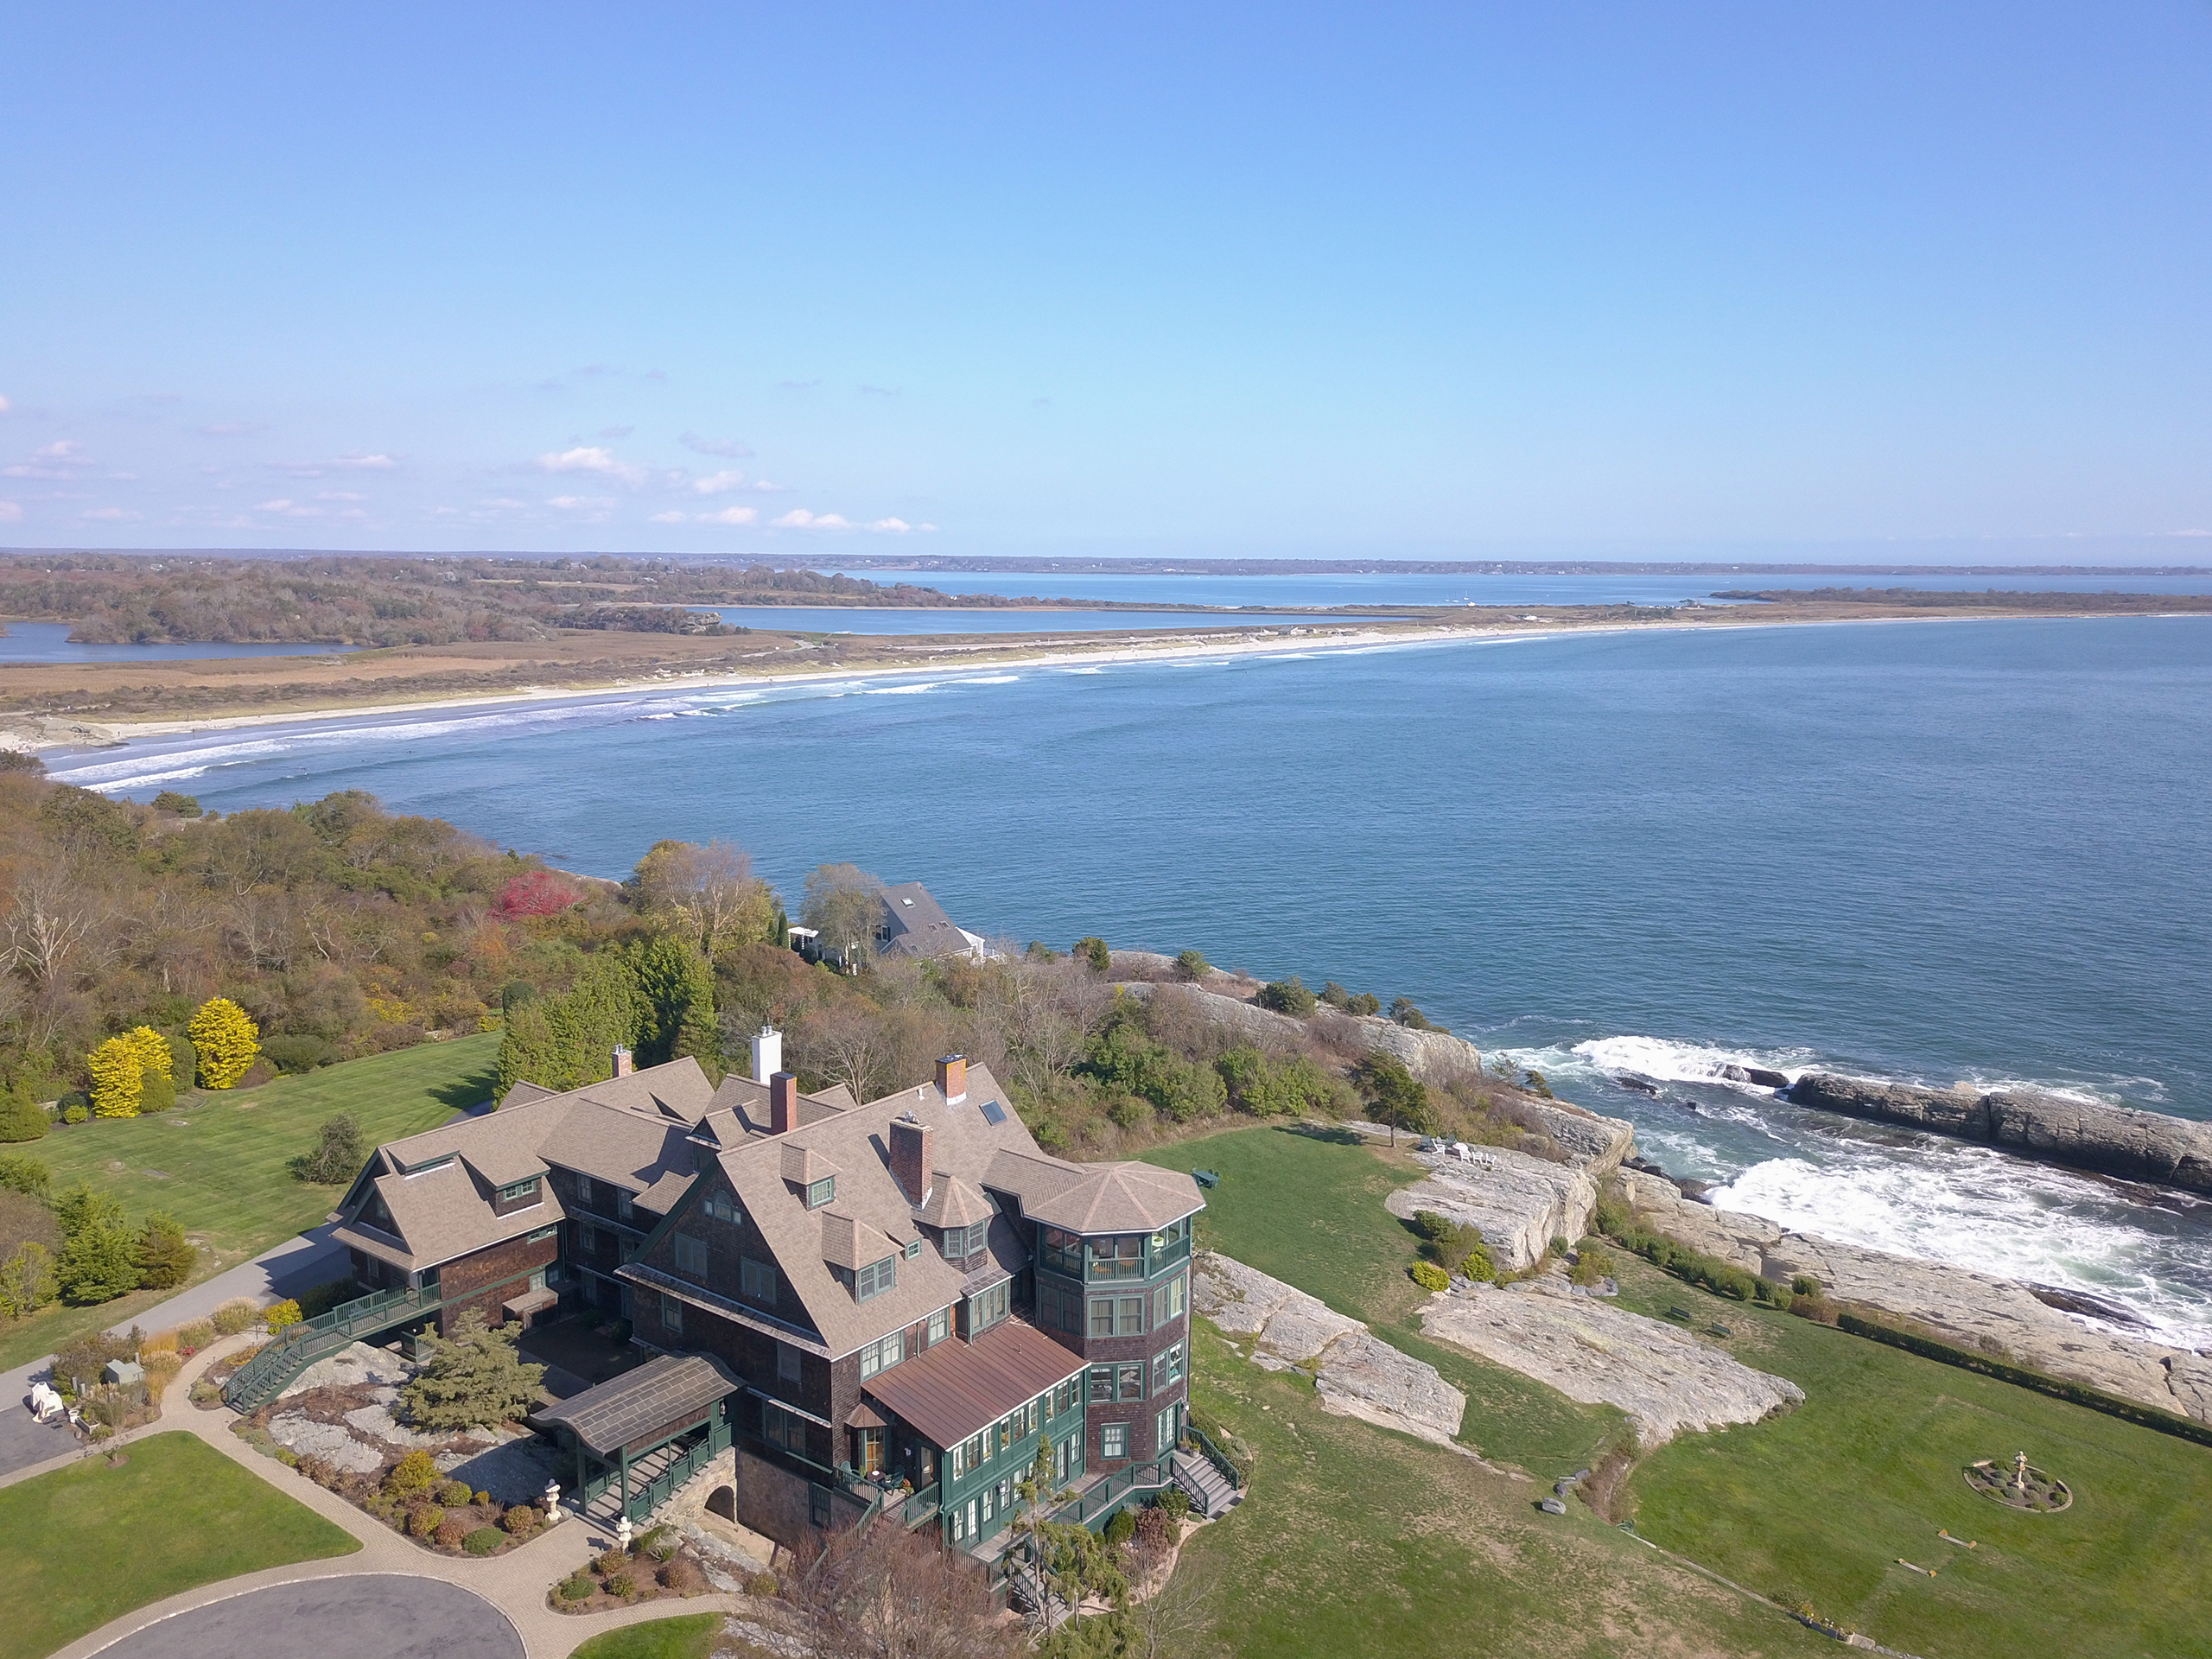
Here's a quick look at what's happening in Newport in with our most expensive properties.  This graph represents the top quartile of listings in Newport - in other words, the most expensive quarter of the market.  Inventory is about 15% higher than it was last fall, but prices are adjusting down creating opportunities for buyers in the market for an upscale home.  If you've been on the fence, this might be the right time to make a move...

P.S. Our research is updated weekly, so check back often and keep your finger on the pulse of things.

Real Estate Market Chart by Altos Research www.altosresearch.com

1963 Views, 0 Comments

The chart below represents Newport's single family market over the last 6 months. According to Statewide MLS data, an average of 17% of available single families are going under contract each month and an average of 8% are selling. If you're a seller it's important to understand that it will take some time for this inventory to be absorbed. If you're a buyer, well, you could be forgiven for thinking it's too turbulent to jump in, but when the pendulum swings (and it always does...) I predict you will look back longingly at this chart.

single_fam_newport_2010_583

55374 Views, 0 Comments

The most frequently asked question i get these days is, "How is the market?"  I reply based on my own experiences or those of my colleagues, but usually my answer goes something like this, "Well, it's slowed down, but things are still selling as long as you price it right."  This is true, of course, but upon closer examination of the numbers, it's clear that inventory levels in and around Aquidneck Island are trending up, and this is likely to put more pressure on prices. This chart is 'live' and will update weekly, so check back to see how things evolve.


Real Estate Market Chart by Altos Research www.altosresearch.com


2113 Views, 0 Comments