I am about to make a bold statement about the Newport, RI real estate market – a statement that’s been made nearly every year since 2006. This time, however, the evidence is strong, sustained and hard to refute, so here it goes:
Newport's residential real estate market has finally, officially, turned a corner.
If you don’t believe me, consider these Newport and Aquidneck Island real estate metrics from RI’s Multiple Listing Service.
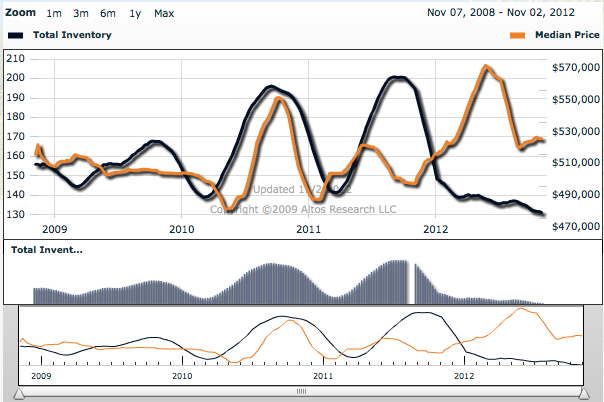
 Median price vs. inventory, Newport, RI, 11/8/12
Iventory
The decrease in the number of homes on the market (the dark line) from fall 2011 to fall 2012 is startling! Approximately 200 homes were on the market last fall versus 130 this fall! Down 35%. Take a look at this chart displaying 4 years of price vs. inventory data for Newport. (NOTE: A larger version of this chart, updated weekly, is always available here.)
Absorption Rate
The Absorption Rate is the number of months it would take to liquidate existing inventory at the current rate. If the number of months is greater than 6 it’s considered a buyer’s market, fewer than 6 a seller’s market. Last October Aquidneck Island had an absorption rate of 16.5 months. This October it was down to 9.5 months! This shows how quickly the market is moving towards equilibrium.
Active/Pending Rate
The A/P rate, or the ratio of pending listings to active listings, shows how quickly the marklet is moving over all. In Newport for October of 2011 it was 16%. This October? 25.6%. WOW. A jump of 10%! I am personally seeing this while scheduling showings. By the time the buyer emails me the listings and we go out for the tour itself, at least 1 house goes under contract! There is no more waiting around in this market.
Appreciation
It is great to see that the market has finally picked up, but what about price appreciation? Nationally the median prices of homes are up 11% from this time last year. Here in Newport, we’ve seen a median sales price jump of 10.4%. The market has actually turned a corner and we’re finally seeing it here at home.

Sales Volume
The number of sales over a 12 month period in Newport is up 20.6%. 2008 – 2011 saw 140-143 sales a year. This year we’ve had 170. Multi family activity is up even higher. Volume is up over 50% compared to 2011. 51 transactions vs 33 this time last year.
I’ve been seeing these improvements happen in my day to day activities representing buyers, but I had to really dig through the data before I could tell you with confidence that we have made the turn! After so many challenging years I’m excited to start helping my clients take advantage of this slowly (but surely) rising tide. If you’d like to discuss the changes underway and how they might affect your real estate choices, please call or email anytime.
Posted by Jeff Brooks on
As the broker, I am always interested in what other real estate practitioners are doing with their web sites and blogs particularly as it pertains to market trends and conditions. Just thought I'd let you know that I enjoyed the time I spent with your blog - Great content. As we all know. Real Estate continues to be high paying hard work and low paying easy work. Thanks for your post and thanks for allowing me this comment.
Posted by Anthony Smrke on Thursday, January 17th, 2013 at 6:01pmLeave A Comment